“Tell me and I forget. Teach me and I remember. Involve me and I learn.” These words, often attributed to Benjamin Franklin, capture the essence of effective teaching: students learn best when they’re directly engaged. But how do you structure that engagement in a way that’s easy to implement and repeatable across lessons?
A KWL chart offers exactly that structure. It encourages learners to activate background knowledge, set personal goals, and reflect on new discoveries. When students are involved in setting their own learning goals, they take more ownership of the outcome. Teachers, in turn, gain insight into how to tailor lessons more effectively. It’s a win-win.
In today’s diverse classrooms, using a KWL chart is a tool for building connections between content and learner experience. This article will walk you through the benefits of the KWL chart and show you how to apply it in the classroom with ease and confidence.
What is a KWL Chart?
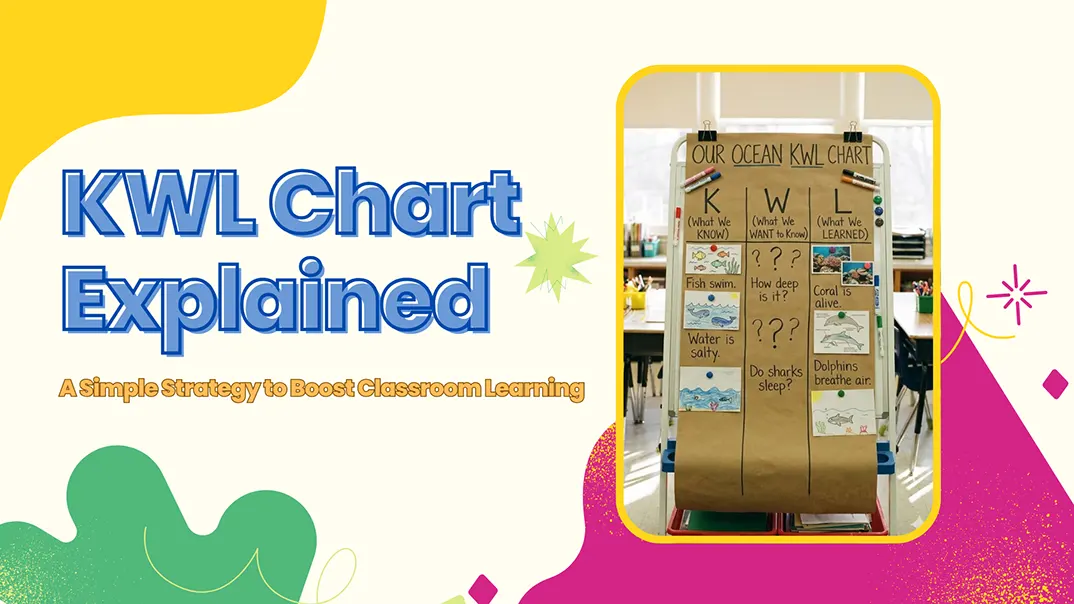
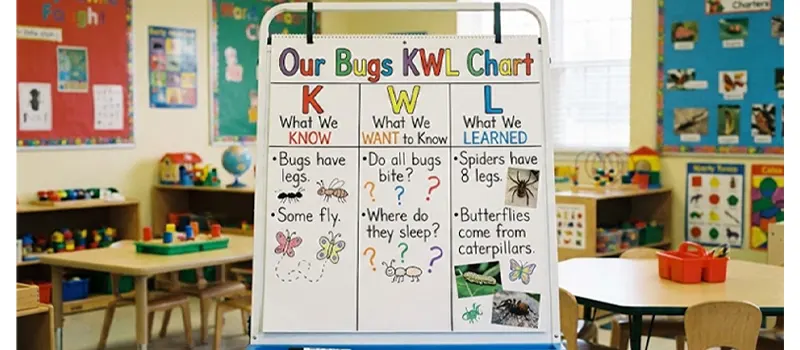
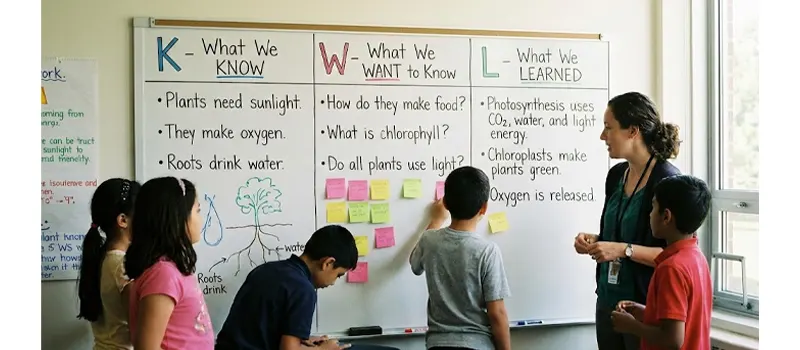
A KWL chart is a three-column graphic organizer designed to help students engage more actively with the learning process. It was first introduced by Donna Ogle in 1986 as a tool for guiding reading comprehension and inquiry-based learning. The name “KWL” stands for Know, Want to Know, and Learned, which represent the three stages of the chart. It provides a clear framework that encourages students to activate prior knowledge, set learning goals, and reflect on what they have gained from a lesson or unit.
The K Column: What Students Know
The K column is completed at the beginning of the lesson. Students think about what they already know about a topic and record their ideas. This step activates prior knowledge and helps them connect new information to existing understanding. The K column can include facts, personal experiences, vocabulary, or even assumptions. For young learners, teachers may accept drawings or oral responses. The goal is to make thinking visible so that students begin the lesson with confidence and curiosity.
The W Column: What Students Want to Learn
The W column is filled with questions, goals, or predictions. Students write what they want to learn or what they hope to find out as the lesson progresses. This step encourages inquiry. It gives students a reason to listen, explore, and search for answers. The W column can include simple questions, deeper research ideas, or wonderings that may not have clear answers. Asking students to explain why they want to learn something can strengthen engagement and provide direction for instruction.
The L Column: What Students Learned
The L column is completed after learning has taken place. Students return to the chart and record what they have learned from reading, discussion, experiments, or instruction. This step encourages reflection and helps students see growth in their understanding. The L column may include facts, conclusions, corrected misunderstandings, or new vocabulary. It can also include questions that remain unanswered. Teachers often use the L column for quick assessments, exit tickets, or portfolio evidence of progress.
Examples of KWL Charts in Action
Using a KWL chart in early childhood education is both simple and effective. Preschool children are naturally curious, and the chart helps them talk about what they already know and what they want to explore. Below are several classroom examples that show how a KWL chart can support real learning.
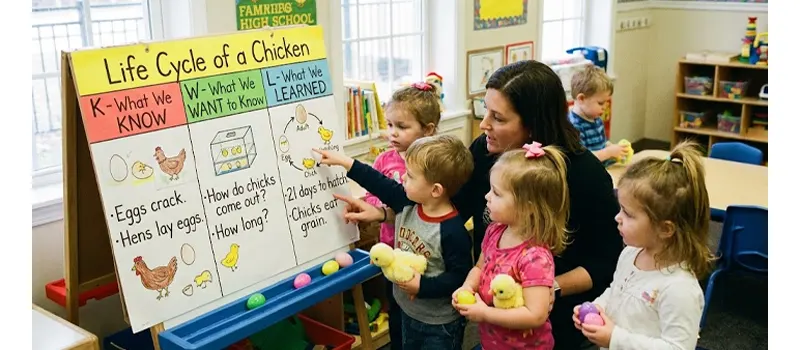
Example 1: Life Cycle of a Chicken
Objective: To introduce the concept of animal life cycles through observation and storytelling.
K: What I Know
- Chickens lay eggs
- Chicks are baby chickens
- Chickens live on farms
W: What I Want to Know
- What happens inside the egg?
- How long does it take for a chick to hatch?
- Do all birds grow like chickens?
L: What I Learned
- Eggs have embryos that grow into chicks
- It takes about 21 days for a chick to hatch
- The life cycle includes egg, chick, and adult chicken
Example 2: One-to-One Correspondence
Objective: To help children understand counting by matching one object to one number or item.
K: What I Know
- I can count to 10
- Each person gets one plate at lunch
- I use my fingers to count
W: What I Want to Know
- Why do I need to match one item at a time?
- What happens if I skip one?
- Can we use toys to practice counting?
L: What I Learned
- One-to-one correspondence means giving one number to one object
- Skipping objects gives the wrong total
- I can use blocks, toys, or food to practice matching numbers
Example 3: Weather and Seasons
Objective: To build understanding of seasonal changes and different types of weather.
K: What I Know
- It rains in spring
- Winter is cold and snowy
- We wear coats when it’s chilly
W: What I Want to Know
- Why does it snow in winter but not in summer?
- What are thunderstorms?
- Do animals do anything special in different seasons?
L: What I Learned
- Seasons change because of the Earth’s movement around the sun
- Different places have different weather patterns
- Some animals hibernate or migrate depending on the season
How to Use K-W-L Charts?
In preschool settings, where children are just beginning to develop language, memory, and reasoning skills, this tool can serve as a bridge between exploration and understanding. To be truly effective, the chart must be more than a worksheet. It should become a living part of classroom conversation, evolving with each question asked and every discovery made.
Introducing the KWL Chart to Young Learners
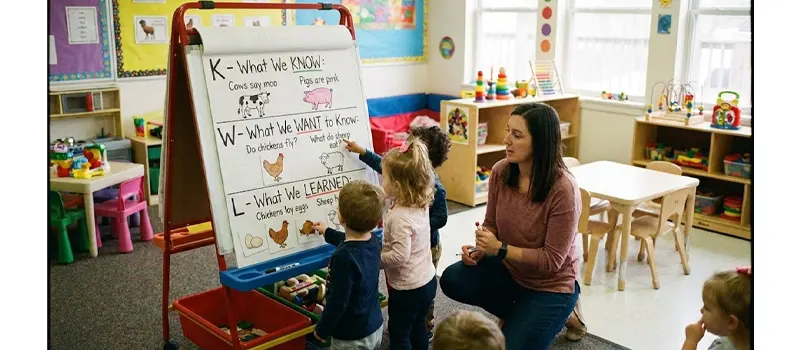
Begin by presenting the KWL chart in a large, visible format on a whiteboard, bulletin board, or digital screen. Since preschoolers respond well to visuals, add icons or images next to each column to support understanding. A lightbulb can stand for ideas they already know, a question mark for what they want to know, and a book or star for what they learned.
Explain the purpose of the chart in simple terms. Say something like, “This chart helps us think about what we know, what we’re curious about, and what we learn after we explore something new.” Keep it interactive and playful to build excitement.
Guiding the “K” Column
Start your lesson or unit by filling in the “K” column as a class. Ask open-ended questions that encourage children to share their existing knowledge or experiences. Even partial thoughts or misconceptions are welcome and useful.
You might say, “What do you know about the weather?” or “Have you ever planted a seed before?” As children respond, write their ideas using short phrases or pictures. This helps activate their background knowledge and gives you insight into where to begin instruction.
Developing the “W” Column
Once children have reflected on what they know, ask them what they’re curious about. This is where the learning becomes personal and purposeful. Encourage wonder by prompting with, “What do you want to learn today?” or “What questions do you have about chickens?” Record their questions or interests in the chart.
Not all children will verbalize their questions easily. In such cases, let them draw their curiosity, point to images, or choose from a set of prepared visual prompts. Their responses shape the focus of your lesson and provide clear learning goals.
Exploring the Topic
As the lesson unfolds, whether through books, games, attività all'aperto, or science experiments, keep the chart visible and accessible. This reminds children of their goals and creates connections between their questions and the learning experience.
Revisit the chart as needed to mark progress or add new questions. You may find that children develop fresh ideas as they interact with new materials, and the chart becomes a living record of their thinking journey.
Completing the “L” Column
After the main learning activities, return to the chart and ask students to reflect. Prompt them with, “What new things did we learn today?” or “Did we find answers to our questions?” Encourage responses in whatever form works best: spoken words, drawings, or gestures.
As students share, record their answers in the final column. Comparing the “W” and “L” sections helps reinforce comprehension and builds confidence. It also provides a natural closure to the topic and makes the learning feel complete.
Making It Preschool-Friendly
Adapt the chart for different learning levels. For example, younger preschoolers might use charts with images instead of text, while older children may try to write or trace letters with guidance. You can also create mini KWL charts for small groups or individual learning folders.
In all cases, keep the process playful, collaborative, and focused on the children’s ideas. The goal is not to complete a worksheet; it is to help children make meaning from their learning experiences.
Using the Chart as a Reflection and Assessment Tool
Once completed, the KWL chart can be displayed in the classroom as a visual summary of the learning journey. Teachers may also use it as part of a portfolio or parent-teacher communication. Reviewing the chart together provides insight into what children have absorbed and where to go next. It’s not only a thinking tool for students, but a valuable assessment strategy for educators.
Benefits of Using KWL Charts in Preschool
A KWL chart makes thinking visible, encourages curiosity, and supports reflection. Students do not simply receive information. They begin by sharing what they know, set goals for what they want to learn, and later record what they have discovered. This structure helps them stay engaged, remember key ideas, and take ownership of their learning. Teachers also use KWL charts to guide instruction, observe progress, and plan support for different learners.
1. Activates Prior Knowledge
Preschoolers come into the classroom with a rich array of experiences and observations. The “K” column gives children an opportunity to share what they already know in their own words, helping teachers tap into this foundation.
- Builds on existing understanding
- Validates children’s experiences and voice
- Helps identify misconceptions early
2. Promotes Curiosity and Inquiry
The “W” column encourages children to ask questions. At this stage, curiosity is a powerful motivator. When students express what they want to know, they take ownership of the learning process.
- Sparks natural curiosity
- Encourages question-asking and exploration
- Aligns instruction with student interests
3. Improves Listening and Speaking Skills
By participating in shared KWL chart activities, preschoolers practice speaking in front of others and listening to their peers. This supports both language development and social-emotional growth.
- Strengthens verbal expression and vocabulary
- Encourages turn-taking and respectful dialogue
- Supports emergent literacy
4. Enhances Comprehension and Memory
Completing the “L” column after a lesson helps children reflect on what they’ve learned. This step reinforces understanding and improves retention by summarizing new knowledge.
- Encourages reflection and consolidation
- Helps teachers assess learning outcomes
- Supports transition from passive to active learning
5. Visual and Developmentally Appropriate
Young learners often respond better to visual tools. The three-column layout of a KWL chart is easy to understand and can be adapted using drawings, icons, or stickers for children who are still developing writing skills.
- Supports visual learners
- Can be customized for non-readers (with pictures or symbols)
6. Encourages Group Collaboration
KWL charts can be completed as a class, in small groups, or individually. In group settings, children learn to work together, share ideas, and listen to different perspectives.
- Builds early teamwork skills
- Promotes inclusion of all voices
- Creates a shared sense of purpose
7. Guides Instruction and Assessment
For teachers, a KWL chart is a formative assessment tool. It reveals what students already know, what they’re eager to learn, and how much they’ve absorbed by the end of the unit.
- Informs lesson planning and pacing
- Helps target areas needing reinforcement
- Provides documentation for learning progress
Common Mistakes When Using KWL Charts in Preschool
Despite their simplicity, KWL charts can lose their effectiveness when misapplied in preschool settings. Young learners require tailored approaches, and overlooking certain details can result in missed learning opportunities. Below are some of the most common mistakes teachers encounter, along with practical ways to avoid them.
Overlooking the “K” Column as a Diagnostic Tool
One of the most frequent mistakes is treating the “K” column as a formality rather than a genuine opportunity to assess prior knowledge. Sometimes, teachers may rush through this step or only allow a few confident students to speak. When this happens, valuable insights are missed. The “K” column should be a chance to surface both accurate and inaccurate ideas. Misconceptions are especially useful, as they reveal what needs to be addressed during instruction.
Tip: Encourage all students to contribute through multiple modes (verbal responses, drawings, or storytelling). This ensures more voices are heard and a more accurate picture of collective understanding is formed.
Treating the “W” Column Too Narrowly
In some classrooms, teachers overly guide the “W” column by suggesting what children should want to learn, rather than letting students ask their own questions. When adults dominate this part of the chart, children become passive participants rather than active thinkers. This reduces curiosity and limits opportunities for children to explore their interests.
Tip: Accept all types of questions, even imaginative or off-topic ones. This helps children feel safe and valued as thinkers, and it can lead to unexpected but meaningful learning paths.
Delaying or Skipping the “L” Column
Another common mistake is forgetting to complete the “L” column after the lesson or waiting too long to revisit it. In the busy rhythm of a preschool day, reflection is sometimes rushed or omitted entirely. Without closure, children may not recognize what they’ve learned or how it connects to their earlier thoughts. The reflective process is essential to consolidate learning and build memory.
Tip: Make the “L” column a joyful, low-pressure activity. Use it during circle time, as part of a drawing task, or in a class discussion. Even one or two responses per child offer insight into their understanding.
Treating the Chart as a One-Time Task
Some educators introduce the KWL chart at the start of the unit and forget to revisit it until the very end, or not at all. This breaks the chart’s role as a dynamic learning tool. KWL charts should be flexible and revisited throughout the learning process. They can be updated, added to, or used as discussion points.
Tip: Keep the chart visible and accessible. Return to it as a way to measure progress or add new ideas as the topic unfolds. This reinforces continuity and keeps students connected to their learning.
Variations of the KWL Chart
Over time, educators and researchers have developed several evidence-based variations of the original KWL chart to support specific learning goals, especially in literacy, science, and inquiry-based instruction. These versions retain the core structure but introduce new components to enhance critical thinking, reflection, or organization.
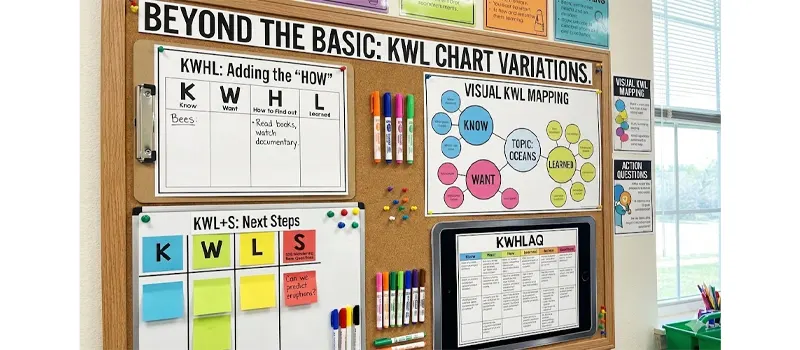
1. KWHL Chart
This is one of the most widely used extensions of the original KWL format, credited to Donna Ogle. It adds a column that prompts students to consider how they will find the answers to their questions. This variation encourages planning and resource awareness, which can be introduced in simple ways even with preschoolers.
- K – What I Know
- W – What I Want to Know
- H – How I Will Find Out
- L – What I Learned
2. KWLS Chart
The KWLS chart extends the reflection process. After completing the “Learned” section, students are asked to think about what they are still curious about. This helps promote continuous inquiry and reinforces the idea that learning doesn’t stop with one lesson.
- K – What I Know
- W – What I Want to Know
- L – What I Learned
- S – What I Still Want to Learn
3. KLEW Chart
Primarily used in early science instruction and aligned with the Next Generation Science Standards (NGSS), the KLEW chart helps students focus on observable evidence. It supports young learners in thinking scientifically by connecting learning goals to evidence and follow-up questions.
- K – What I Think I Know
- L – What I Am Learning
- E – What Evidence Supports My Learning
- W – What I Still Wonder
4. KWL Plus (KWL+)
This variation builds on the original KWL chart by adding a post-learning structure step, such as categorizing or mapping the new information. It is especially helpful for older preschoolers or early elementary students transitioning into deeper thematic units.
- K – What I Know
- W – What I Want to Know
- L – What I Learned
- + – How I Can Organize or Categorize What I Learned (e.g., using a graphic organizer, picture chart, or simple sorting activity)
5. KWLHAQ Chart
This extended form of the KWL chart includes Action and Questions columns. It’s useful for project-based learning or problem-solving lessons where students identify follow-up tasks and lingering questions.
- K: What I Know
- W: What I Want to Know
- H: How I Will Learn It
- L: What I Learned
- UN: What Action Will I Take
- Q: What New Questions Do I Have
6. Visual KWL Mapping
Instead of using columns, this variation organizes the KWL format using mind mapping or bubble maps. It works well with visual learners and can be adapted for young students using pictures, color coding, or icons. The topic sits in the center, with ideas branching out around it.
- Know: Blue bubbles
- Want: Pink bubbles
- Learned: Yellow bubbles
Domande frequenti
What are the disadvantages of KWL?
A KWL chart may take more time than a quick worksheet, especially if students need support with speaking or writing. Some children may offer guesses or incomplete ideas, which require guidance later. The chart is most effective when used as part of discussion rather than left for students to complete alone.
Is a KWL chart formative or summative?
A KWL chart is mainly a formative assessment tool. It helps teachers observe what students know, what they want to learn, and what they have learned, then adjust instruction as needed. It is not usually graded but used to support learning.
Do KWL charts need to be completed individually?
No. A KWL chart can be completed as a whole class, in small groups, or individually. Preschool and early elementary students often benefit from shared charts, while older students may complete their own version.
What age is a KWL chart good for?
A KWL chart works for a wide range of ages. Preschoolers can draw or dictate their ideas, elementary students can write simple statements, and older students can use it for research or inquiry projects. The structure is flexible.
Do children need to write on the chart themselves?
Not necessarily. Young children can draw pictures or tell the teacher what to write. The goal is to organize thinking, not to measure handwriting skills. Teachers often write or model writing while children contribute ideas.
Conclusione
A KWL chart is a simple tool that makes learning more active, organized, and meaningful. By recording what students know, what they want to learn, and what they have learned, the chart encourages curiosity and reflection. It gives students a voice in the learning process and helps them build confidence as they see their understanding grow.
By using a KWL chart regularly, teachers help children develop habits that extend beyond a single lesson. They learn to connect ideas, set goals, and celebrate progress. A small chart with three columns can have a lasting impact, showing students that learning is not only about answers, but also about wonder and discovery.